Scatter 3D
Give each observation an x, y and z coordinate. Klyn projects the cloud into a perspective view, with three graduated axes and depth-shaded markers.
A Gaussian Cloud
NDArray<Double>.randn(100) draws 100 samples from the standard
normal distribution (mean 0, standard deviation 1). Three independent calls give three
coordinates for each observation.
import klyn.math
import klyn.gui.windows.charts

x = NDArray<Double>.randn(100)
y = NDArray<Double>.randn(100)
z = NDArray<Double>.randn(100)

chart = KlynPlot("3D scatter", projection="3d")
chart.size = (700, 700)
chart.title = "A cloud in three dimensions"
chart.xLabel = "X"
chart.yLabel = "Y"
chart.zLabel = "Z"
chart.scatter(x, y, z)
chart.show()
The size is in pixels. At the renderer's 100 DPI reference, (700, 700)
corresponds to a 7x7 inch figure. The native window decorations are outside the chart.
Rendering uses Klyn Painter, without an external plotting library or an OpenGL dependency.
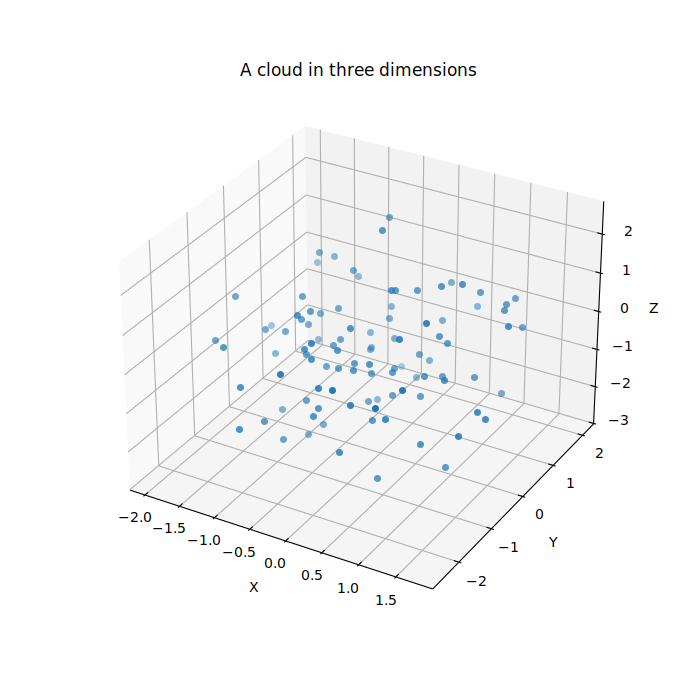
Projection and Depth
projection="3d" is selected when constructing the chart. The default
view looks at the centre of a 4:4:3 data box, with an elevation of 30 degrees and an
azimuth of -60 degrees.
Markers are drawn back to front and shaded by depth. The grid is visible by default.
chart.view(elevation=25.0, azimuth=-45.0)
chart.xLim(-3.0, 3.0)
chart.yLim(-3.0, 3.0)
chart.zLim(-3.0, 3.0)
chart.grid(false)
chart.autoscale()
Angles are degrees. Elevation must be strictly between -90 and 90 and both angles must be finite. Limits must be finite and increasing. This release supports 3D scatter, not surfaces, meshes or 3D line plots.
The autonomous window and the embedded widget share the same mouse controls:
- Left-button drag: orbit around the data box.
- Middle-button drag: pan along the screen's horizontal and vertical axes.
- Right-button drag: drag upwards to zoom in, downwards to zoom out.
A drag continues when the pointer leaves the chart and stops when its button is
released. Call
chart.resetView() to restore the initial camera, pan and zoom without
removing series or explicit data limits.
The Same Data Contract
scatter(x, y, z, label="", color="", size=20.0) accepts three
one-dimensional NDArray<Double> arrays or three IList<Double>
lists of equal length. Coordinates are copied. Non-finite triples are omitted and
markers outside manual limits are hidden. Sizes are square points, just as in 2D.
Calling the three-coordinate overload on a 2D chart, or a two-coordinate drawing
operation on a 3D chart, raises ValueException rather than silently ignoring
coordinates. Empty series and constant coordinates still produce usable axes.
randn() uses the Box-Muller transform, not a bounded approximation.
Distribution tests should use statistical tolerances, not
a fixed expected sequence or a guaranteed sign for the first two samples.
Embed and Export
Use KlynPlotWidget(projection="3d") inside any Klyn layout. Its
scatter, view, labels and limits behave exactly like the autonomous
KlynPlot. With a native GUI window open, export with
chart.exportImage(Path("cloud.png"), 700, 700) after importing klyn.io.
klyn samples/gui/charts/Scatter3DSample.knThe capture above was produced on Linux; native font rasterization may vary on Windows.